Employees of the Digital Scholarship Lab recently released a new mapping project: Electing the House of Representatives.
They published the map at this time because it is a midterm election year, said Robert Nelson, the director of the DSL.
“This seemed like a moment to not just help people think about what’s going to be happening next week but maybe help them think about the kind of broader sweep of American congressional elections by mapping these over the course of about two centuries,” Nelson said.
The map contains data from 1840 to 2016. It is part of the American Panorama project, which Nelson and his team have been working on for the past several years, Nelson said.
LaDale Winling, associate professor of history at Virginia Polytechnic Institute and State University, pitched the idea for the mapping project to the DSL, Nelson said.
In graduate school, Winling developed the idea of creating access to a large data set of congressional elections because he wanted to be able to show maps of congressional elections in his lectures. Winling began building the data set for this project about five years ago, he said.
He and his team at Virginia Tech generated the authoritative data set, he said.
“I want to give absolute and appropriate credit to Rob and the Digital Scholarship Lab,” Winling said. “It was through the collaboration that this specific kind of formulation for this project took shape.”
Nelson worked to develop the digital visualization and interactivity of the map, Nelson said.
“We do dumb things and then we do less dumb things and we do less dumb things and there’s a kind of process where we gradually improve things until we get something we’re happy with, we’re proud of, that we think actually portrays a story or stories that we hope will surface effectively,” Nelson said.
He said he wanted to invite exploration and to surprise people with the various functions of the map.
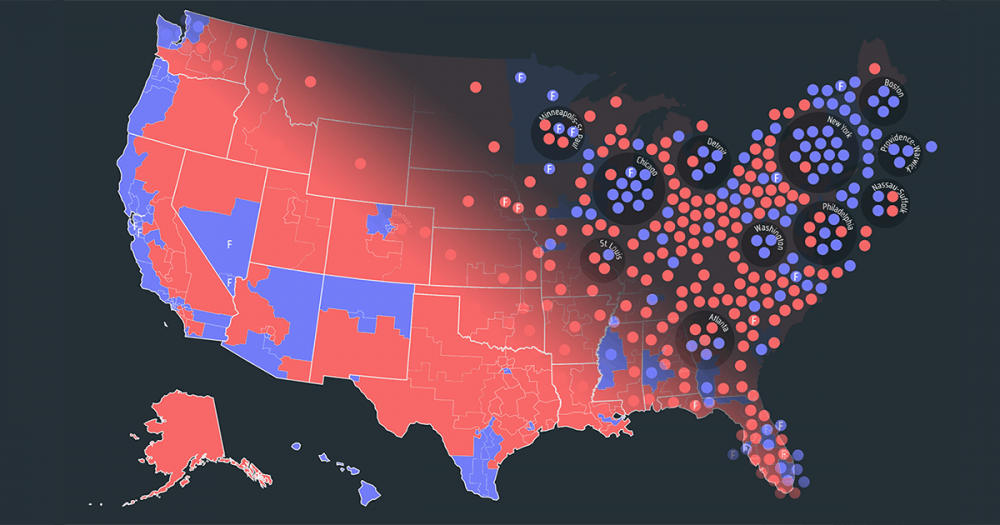
Electing the House of Representatives contains a cartogram, a quantitative representation on a map or visual component. There is the mistaken idea that in the 20th century the South was Democratic and the Midwest and North were Republican, Nelson said. If you look at a cartogram, you see that was true in the rural areas, but if you look at cities then you see that it was not true, he said.
Enjoy what you're reading?
Signup for our newsletter
Nelson wanted to create conventional maps that showed regional patterns, he said. He said he thought cartograms were a good way to do so.
Nelson’s ability to make the data interactive is better than the New York Times election maps, Winling said.
Nelson said he took inspiration from the New York Times and thought it did spectacular work.
“They do the news, we do the ‘olds,’” he said.
The New York Times focused on the present, whereas the DSL was historical in its preoccupations, he said.
Electing the House of Representatives complements the work of FiveThirtyEight, a data journalism website, Nelson said. FiveThirtyEight published a project called Forecasting the Race for the House. Both created a map and a cartogram and worked on their projects at the same time, he said.
Electing the House of Representatives goes back further in history than Forecasting the Race for the House does, Nelson said.
Students Ava Clarke, Katrina Hayes-Macaluso, Chloe McKinney and Anna Moorhead worked on the mapping project as well.
Clarke used “The Historical Atlas of Political Parties in the United States Congress: 1789-1989” by Kenneth Martis to look for discrepancies in the data set of the election winners in each district in each state, she said.
Winling worked with the DSL on Mapping Inequality: Redlining in New Deal America, a mapping project the DSL published. Winling and the employees of the DSL developed a rewarding relationship while working on these two projects, he said.
“I sing the praises of the Digital Scholarship Lab and Rob and Justin because now we’ve had two very, very fruitful collaborations,” Winling said. “I would say the DSL is probably the top, kind of like, digital history and data visualization institution in the country, certainly among historians like among digital history and spatial history kinds of university projects.”
Justin Madron, GIS project manager and analyst for the DSL, worked on the geo-spatial data for Electing the House of Representatives, Winling said.
The DSL plans on releasing projects about both presidential and Senate elections that will be similar to the Electing the House of Representatives project, Nelson said. He said the projects were projected to be completed before the 2020 elections.
Nelson said he hoped that people viewing the mapping project would take away a lot of little things rather than one big thing. He wanted people to appreciate both continuities and discontinuities in American electoral politics, he said.
A continuity is that the urban and rural divide that exists today is nothing new, he said.
A discontinuity is the difference between plural-member districts and single-member districts. An example of this is 1932, when there were general-ticket elections in some states, Nelson said.
With regard to the upcoming election, Nelson said, “Appreciation and investment in the democratic process seems to me very necessary.”
These elections represent the most democratic part of the federal government that we, as U.S. citizens, have, Nelson said.
Contact senior news writer Victoria Davis at victoria.davis@richmond.edu.
Support independent student media
You can make a tax-deductible donation by clicking the button below, which takes you to our secure PayPal account. The page is set up to receive contributions in whatever amount you designate. We look forward to using the money we raise to further our mission of providing honest and accurate information to students, faculty, staff, alumni and others in the general public.
Donate NowRead More

OPINION: Stewards of fire
By Lucas Chuidian | December 15, 2025