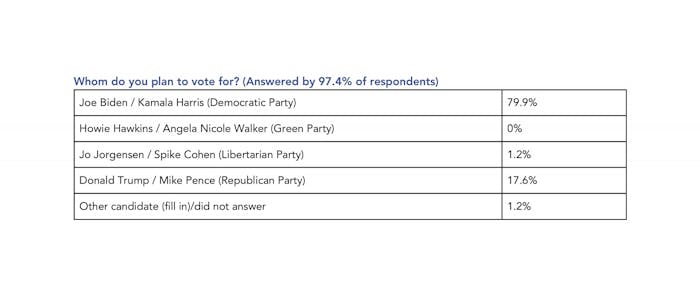
Ninety percent of University of Richmond undergraduate students who self-selected to complete a recent Collegian poll said they planned to vote in the 2020 U.S. presidential election. 78% of those students said they planned to vote for Joe Biden and Kamala Harris of the Democratic Party.
However, not all respondents who planned to vote strongly supported their candidate. Respondents who said they were voting for a specific candidate were also asked to indicate their level of support for the candidate (see Poll Question 21).
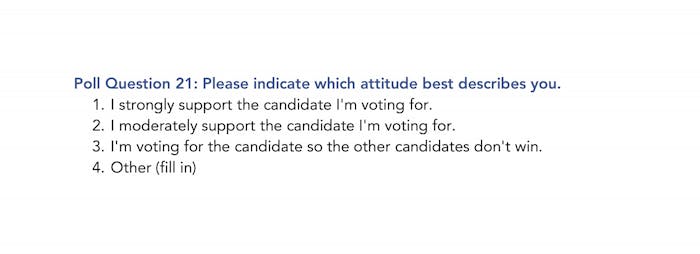
Those who planned to vote for Biden/Harris were more likely to say they were voting for their candidate so other candidates did not win (that is, response three). In contrast, those voting for incumbents Donald Trump and Mike Pence of the Republican Party were more likely to say they strongly supported their candidate (response one).
The poll, available to students Oct. 18 to 28, asked a variety of questions about the election and campus political culture. It received 543 responses, a sample equal to a little less than 20% of the traditionally enrolled undergraduate student population, based on numbers in the 2019-20 UR Factbook. This sample size has a 3% margin of error, which means all results were calculated to be accurate of the whole student population within three percentage points 95% of the time.
Although a link to the poll was sent to all undergraduate students whose emails were in the UR student directory in an attempt to obtain as wide a sample as possible, it is important to note that students responded to the poll on a voluntary basis. This means that results cannot be interpreted as representative of the opinions of the entire student body.
92% of poll respondents indicated they planned to vote in the upcoming election, with 6% not planning or ineligible to vote and 2% still unsure. Of those students who planned to vote in the election, 3% were unsure which candidate they would vote for. 92% of those students said none of the candidates appealed to them but they felt they should vote.
The rest of the students who planned to vote were mostly split between the Democratic and Republican party candidates, with a small minority of students voting for the Libertarian candidate, an unlisted candidate or preferring not to answer the question.
80% of voting students plan to vote for Biden/Harris; 18% plan to vote for Trump/Pence.
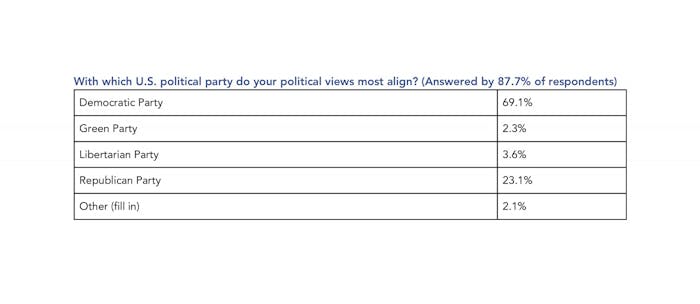
Students were also asked whether their political views aligned with those of a U.S. political party. Almost 90% of respondents said their views strongly or moderately aligned with a party.
Of those students, about 7 in 10 responded in a following question that their views aligned with the Democratic Party. About 2 in 10 said their views aligned with the Republican Party.
Enjoy what you're reading?
Signup for our newsletter
When it came to the voting patterns of students who said their views aligned with a political party, respondents who categorized themselves as Democrats and Republicans tended to plan to vote along party lines, although about 1 in 7 Republican-aligned voters said they would vote for Biden/Harris.
It is important to note that some students, especially Republican-aligned students and/or those voting for Trump/Pence, may have chosen not to respond or may have responded inaccurately to the poll because of social desirability bias and shy voting.
The concept of a “shy Trump voter” was widely discussed during and after the 2016 election, when it was suggested that “some voters may perceive it is socially undesirable to admit support for the Republican nominee” to people, including pollsters, thus skewing the accuracy of poll results. Some have disputed the theory that such “shy voters” caused 2016 polls to underestimate Trump’s likelihood of winning.
Elements of the Collegian poll results did underline that respondents voting for Trump/Pence felt themselves to be in the political minority on campus. 77% of respondents who said they planned to vote for Trump/Pence also thought fewer than 50% of UR students shared their political beliefs (see Poll Question 11).
In comparison, just 21% of Biden/Harris voters thought fewer than 50% of students shared their beliefs; 44% thought about 50% of students shared their beliefs, and 32% thought more than 50% shared their beliefs.

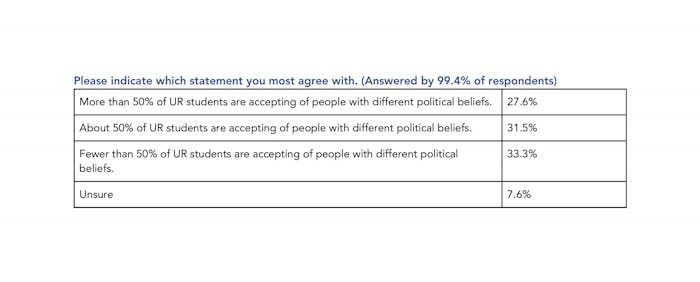
Students were also asked whether they felt UR students were accepting of people with different political beliefs. Of the 99% of respondents who answered the question, a majority said about half or fewer than half of students were accepting of people with different political beliefs.
Methodology
A link to the poll was emailed in batches, from Oct. 23 to 27, to all undergraduate students whose email addresses were listed in the UR student directory as of Oct. 22. SpiderBytes announcements with a link to the poll were also published on Oct. 20, 27 and 29. A pop-up with a link to the poll also appeared on the Collegian website.
543 students responded to the survey by 11:59 p.m. on Wed., Oct. 28, a sample equal to roughly 18.7% of the traditionally enrolled undergraduate student population, based on numbers in the 2019-20 UR Factbook. The class years were relatively evenly represented, with 27.4% of respondents being seniors, 23.9% juniors, 25.2% sophomores and 23.4% first-years.
The poll gathered several points of demographic data from respondents in an effort to ensure clarity about how representative the results were of the UR student body as a whole. However, results from this poll should not be interpreted as representing the opinions of the entire UR student body. This poll relied on volunteer, non-probability sampling, meaning that students had to self select to answer the poll. This means that some sections of the student body may have opted not to respond to the poll; consequently, their views may not be represented in the poll results.
Senior Emily Turkington contributed to poll data analysis.
Contact copy chief Caroline Fernandez at caroline.fernandez@richmond.edu.
Support independent student media
You can make a tax-deductible donation by clicking the button below, which takes you to our secure PayPal account. The page is set up to receive contributions in whatever amount you designate. We look forward to using the money we raise to further our mission of providing honest and accurate information to students, faculty, staff, alumni and others in the general public.
Donate NowRead More